A Brief Look at NBFC Space and the Anatomy of Capri Global
India’s NBFC Sector: A New Phase of Structural Maturity and Inclusive Credit Growth
India’s Non-Banking Financial Company (NBFC) sector is undergoing a defining transformation, emerging as a key force reshaping retail finance and credit penetration across both urban and rural landscapes. As FY25 unfolds, the sector is not merely rebounding, it is expanding at scale, with robust projections and diversified tailwinds that reinforce its systemic relevance.
Backed by digital transformation, growing rural outreach, and regulatory enhancements, NBFCs are projected to clock a credit growth of 13–14% in FY25, continuing a steady expansion of 13–15% through FY27. This momentum is mirrored in Assets Under Management (AUM), which is set to grow by 14–17% in FY26, after rebounding from low single-digit growth through FY20–22 to 11–12% by FY23, driven by resurgent demand and renewed risk appetite.
This renewed strength is anchored in retail finance, with home loans and vehicle loans each comprising 25–27% of NBFC AUM. Affordable home loans under ₹25 lakh are particularly pivotal, projected to grow at 12–14% annually. Retail credit’s share of total NBFC credit has inched upward from 54% in FY18 to a projected 56% in FY25, highlighting the sector’s role in democratizing credit.
The scale of capital flow into the sector underscores growing confidence. Public funds invested in NBFCs rose from US$278 billion in 2016 to US$471 billion by 2020, at a CAGR of 14.04%. Meanwhile, NBFCs’ overall credit market share remains stable at 22%, bolstered by tech-enabled distribution and bancassurance partnerships that reduce operational drag while scaling rural penetration, where two-thirds of India’s population remains a largely untapped growth engine.
A particularly noteworthy development is the surge in green financing potential. NBFCs are positioned to catalyze India’s energy transition, with green finance projections increasing nearly 6x from ₹1,863 lakh crore in FY17–23 to ₹8,599 lakh crore in FY24–30. This trajectory not only reflects ESG-aligned diversification but also offers a structural moat as global capital tilts toward climate-aligned assets.
Operationally, NBFCs have demonstrated extraordinary resilience and efficiency despite lacking the extensive physical infrastructure of banks. Their digital-first approach, granular credit underwriting, and agile customer servicing models have positioned them as formidable competitors across the credit spectrum, from consumer durables to SME lending.
This structural outperformance becomes evident when comparing long-term credit growth. Between 2008 and 2023, NBFCs have consistently outpaced banks in terms of YoY AUM growth, even during macro shocks like the Global Financial Crisis (2008), Demonetization (2016), IL\&FS default (2018), and COVID-19 (2020). The data below underscores this:
| Year | Bank Credit Growth (%) | NBFC AUM Growth (%) |
|---|---|---|
| 2008 | 25 | 33 |
| 2010 | 8 | 27 |
| 2013 | 27 | 26 |
| 2018 | 19 | 19 |
| 2023 | 10 | 18 |
However, the sector's growth hasn’t been without friction. The Reserve Bank of India (RBI) has raised red flags on the “growth at any cost” approach. In FY25, funding access tightened, partly due to revised norms on bank lending to NBFCs. An ICRA report (Aug 2024) projects profitability contraction of 25–45 basis points versus FY24, triggered by elevated funding costs and rising competition from banks. Yet, many of these regulatory tightening moves, though restrictive in the short term are viewed as necessary correctives for long-term sectoral hygiene.
Reassuringly, NBFCs still boast robust creditworthiness. As of June 2024, a staggering 90% of NBFCs were rated 'A' and above, sustaining a streak of high-grade profiles since FY23. The proportion of AAA-rated NBFCs surged from 36.9% in June 2022 to 66.5% in June 2023, showing broad-based strengthening. Bank of India, for example, reported a rising share of AAA-rated NBFC exposure, 72% in June 2023 to 74% in June 2024.
Securitization is also surging, as NBFCs seek to diversify and optimize funding. FY25 securitization volumes are expected to reach ₹2.1 trillion, up 11% YoY, marking it a vital capital-raising channel amid tightening liquidity.
Company-Level Performance Snapshot (FY25)
The NBFC narrative becomes even more compelling when viewed through the lens of individual firm performance. Select NBFCs have delivered exceptional growth in AUM, profitability, and asset quality, reinforcing the sector’s resilience and scalability.
The table below summarizes FY25 performance across key NBFCs:
| Company | AUM (₹ Cr) | PAT (₹ Cr) | AUM Growth YoY (%) | Gross NPA (%) | Capital Adequacy (%) |
|---|---|---|---|---|---|
| SBFC Finance | 8,747 | 345 | 28 | 3 | 36 |
| PNB Housing Finance | 80,397 | 1,936 | 13 | 1 | 29 |
| Aditya Birla Finance (ABFL) | 1,26,351 | 3,142† | 20 | 3.78† | 17 |
| Poonawalla Fincorp | 35,631 | –98‡ | 43 | 2 | 23 |
| Five-Star Business Finance | 11,877 | 1,073 | 23 | 2 | 50 |
| Home First Finance | 12,713 | 382 | 31 | 2 | 33 |
| Akme Fintrade | 619 | 33 | 45 | 3 | 58 |
| Sammaan Capital | 62,346 | 324 | 41 | 1 | 35 |
| Shriram Finance | 2,63,190 | 8,272 | 17 | 5 | 21 |
| Repco Home Finance | 14,492 | 439 | 7 | 3 | 35 |
| Capri Global Capital | 22,857 | 479 | 46 | 2 | 23 |
| Aavas Financiers | 20,420 | 574 | 18 | 1 | 45 |
| Aptus Value Housing | 10,865 | 751 | 25 | 1 | 70 |
* For ABFL the disclosure is “Gross Stage 2 + 3 ratio”; Stage-3 alone is \<2 %, but the consolidated risk rubric is shown here for apples-to-apples prudence.
† ABFL now reports inside the parent; ₹3,142 cr is consolidated PAT attributable to shareholders after minority interest.
Notably, Capri Global, Akme Fintrade, Poonawalla Fincorp, and Sammaan Capital posted AUM growth exceeding 40%, signalling aggressive portfolio expansion and rising market penetration. On the profitability front, players like Five-Star Business Finance, Aptus Value Housing, and Aditya Birla Finance delivered strong double- or triple-digit PAT figures, reflecting operational efficiency and disciplined lending.
Asset quality remained broadly stable across the board, with most lenders maintaining GNPA ratios below 2%. However, institutions like Shriram Finance and Repco Home Finance continue to grapple with elevated stress levels, reporting GNPAs of 4.55% and 3.3% respectively, underscoring the legacy risk embedded in parts of their loan books.
Meanwhile, capital adequacy paints a reassuring picture, with firms such as Aptus (70%), Five-Star (50.1%), and Aavas (44.5%) holding substantial buffers to support further growth without immediate dilution.
A Summary of Capri Global
Capri Global Capital (CGCL) has morphed from a niche construction‑finance outfit into a multi‑product, technology‑laden secured‑lending platform producing 46 % YoY AUM growth, 11.8 % ROE (16.9 % annualised in Q4 FY25), and a consolidated GNPA of 1.5 %, all while pursuing a bold ₹50,000 crore AUM target by FY28. Yet the same period exposed a credibility dent: management’s 2023 statement of “no fresh equity for 6–7 years” unravelled within 24 months, pressuring leverage to 3.7× and forcing a ₹2,000 crore QIP.
This report fuses a forensic scorecard with a boots‑on‑the‑ground narrative, surfacing dazzling operating cadence and the hair‑line cracks that keep the rating at cautious buy.
Key Watch‑Items
- Capital trajectory. CRAR erosion (−1,700 bp in two years) must reverse post‑QIP; leverage > 4× invalidates the secured‑lending thesis.
- Co‑lending opacity. Off‑book pools trebled to ₹4,079 crore; investors need GNPA waterfalls and partner risk‑sharing disclosures.
- Tech hype vs loss curves. ML underwriting cut MSME TAT by 15 days and shaved fresh slippage but provision volatility (₹30 mn ⇄ ₹464 mn) demands vintage analysis, not anecdotes.
If CGCL sustains ≥ 27 % AUM CAGR, ≤ 1 % NNPA, and ≥ 16 % ROE through FY28 without material dilution, the stock graduates from “story” to “compounder.”
Prologue : Lightning Over Nariman Point
When CFO Karan Gupta flashed the final slide at Trident: ₹50,000 crore AUM, ROE ≥ 16 %, Net NPA \< 1 % by FY28. The ambition sounded reckless until one rewinds CGCL’s last three balance‑sheets: AUM 2.2× since FY23, spreads +140 bp, GNPA −40 bp, and a branch count of 1,111 across 19 states.
The audacity, it turns out, is scaffolded on statistical sobriety.
Pillar‑by‑Pillar Forensic Assessment
Guidance Adherence
| Metric | Management Guide | Actual FY25 | Status | Commentary |
|---|---|---|---|---|
| AUM | ₹30,000 cr by FY27 → reset to ₹50,000 cr by FY28 | ₹22,857 cr | Ahead of runway | 75% of original FY27 goal already achieved; new FY28 target plausible at 27–30% CAGR |
| ROE | 10.5–11% FY25; 15% FY27 | 11.8% FY25; 16.9% Q4 | Beat | Run-rate pierces FY27 threshold two years early |
| Net NPA | ≤ 1% structural | 0.9% | Met | Risk appetite intact |
| Capital needs | "No fresh equity 6–7 yrs" (Q4 FY23) | Board cleared ₹2,000 cr QIP (Jun 25) | Miss | Credibility dent on long-range funding visibility |
Operating delivery is stellar, but the unexpected equity raise forces a tempered rating. Treat forward claims on capital sufficiency skeptically until a formal leverage‑band policy is published.
Financial‑Reporting Standards
| Attribute | Evidence | Quality Marker |
|---|---|---|
| Depth & segmentation | Product-level NPA, credit-cost splits | High granularity |
| GAAP integrity | PAT surge NII-led (+49% YoY) | No fair-value gains |
| Audit trail | Deloitte, unmodified opinions | Zero resignations |
| Watch-outs | Provision & co-lending disclosure gaps | Needs scrutiny |
CGCL publishes more slices of portfolio risk than most AA‑rated NBFC peers. The remaining blind spot is the fast‑rising co‑lending book, break‑outs by partner and waterfall are overdue.
Management Responses & Governance
| Attribute | Observation | Assessment |
|---|---|---|
| Quantified Q\&A | Guides ROE, spreads in bp bands | Transparent |
| Tone realism | Flagged tech-migration drag early | Credible |
| Board hygiene | 6 independents, 85% independent | Best-practice |
| Cultural markers | “Compliance first” mantra | High-grade |
Basis‑point guidance plus real‑time admission of mis‑steps underpin governance quality despite the capital‑raise U‑turn.
Capital Allocation
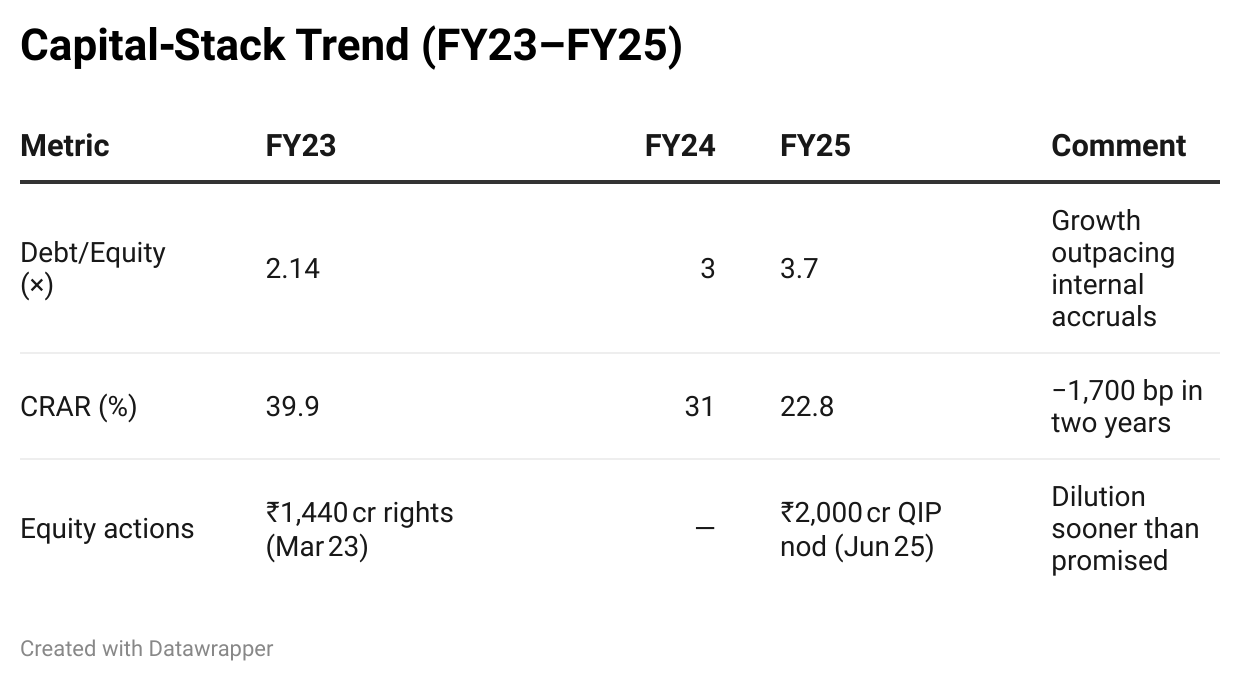
| Metric | FY23 | FY24 | FY25 | Comment |
|---|---|---|---|---|
| Debt/Equity (×) | 2.14 | 3 | 3.7 | Growth outpacing internal accruals |
| CRAR (%) | 39.9 | 31 | 22.8 | \~1,700 bp in two years |
| Equity actions | ₹1,440 cr rights (Mar 23) | — | ₹2,000 cr QIP nod (Jun 25) | Dilution sooner than promised |
Leverage now sits just 30 bp below management’s 4× ceiling. The QIP buys breathing room, but another 18 months of 27 % CAGR without robust internal generation would compel yet another dilution.
Operations & Strategy Execution
| KPI | FY24 | FY25 | Delta | Driver |
|---|---|---|---|---|
| Cost/Income (%) | 71 | 55 | −1,570 bp | Tech leverage |
| Branches (no.) | 750 | 997 | 247 | Gold rollout |
| AUM (₹ cr) | 15,653 | 22,857 | 7,204 | Multi-segment push |
A tech budget that resembles a mid‑sized IT‑services firm buys CGCL both origination velocity and collection resilience. Part of the QIP will fund generative‑AI fraud detectors and compliance dashboards, targeting another 10 bp reduction in credit cost by FY27.
Capri’s Lending Genome : Four Chromosomes, One Organism
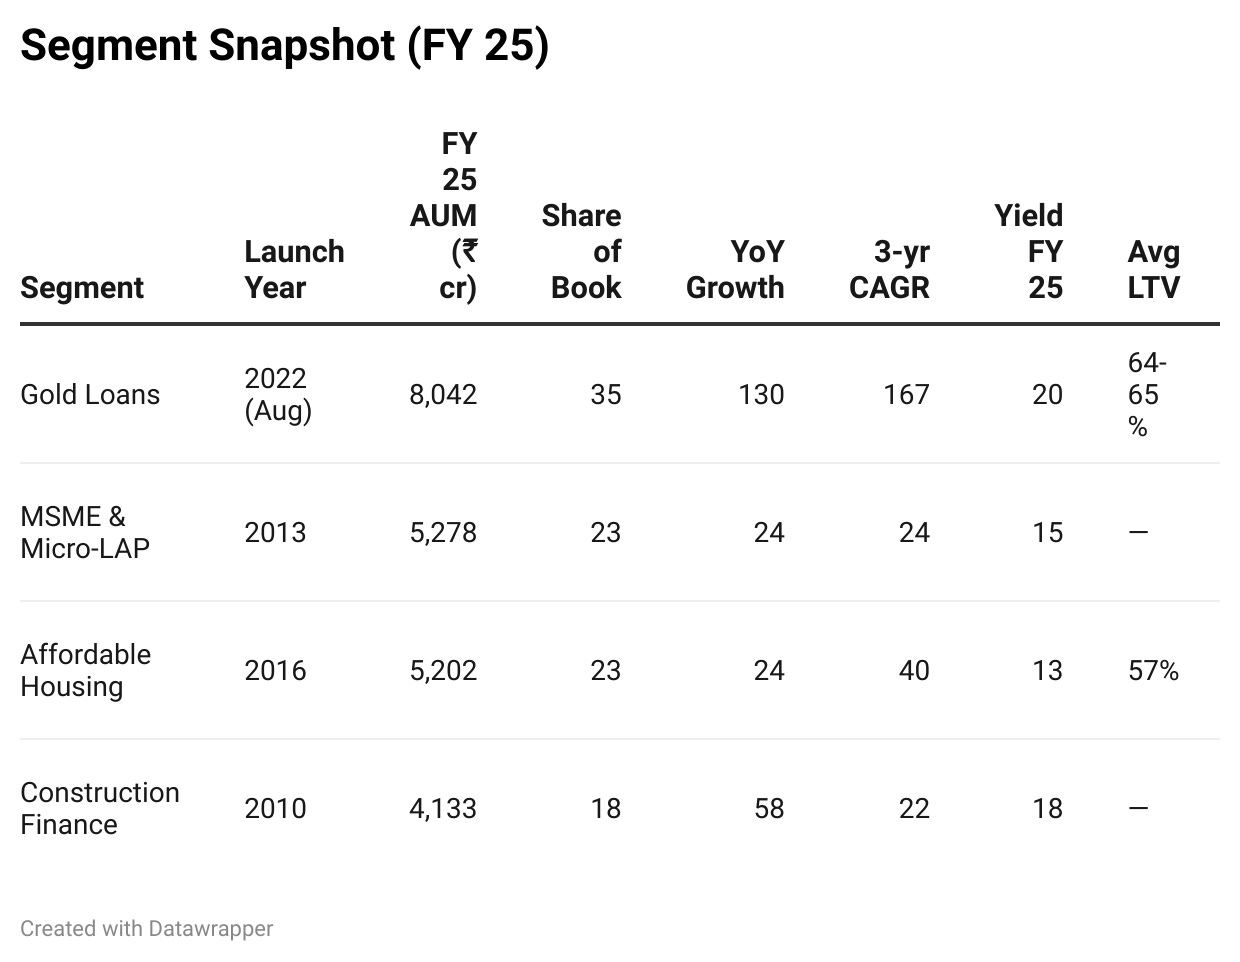
| Segment | Launch Year | FY25 AUM (₹ cr) | Share of Book (%) | YoY Growth (%) | 3-yr CAGR (%) | Yield FY25 (%) | Avg LTV |
|---|---|---|---|---|---|---|---|
| Gold Loans | 2022 (Aug) | 8,042 | 35 | 130 | 167 | 20 | 64–65% |
| MSME & Micro-LAP | 2013 | 5,278 | 23 | 24 | 24 | 15 | — |
| Affordable Housing | 2016 | 5,202 | 23 | 24 | 40 | 13 | 57% |
| Construction Finance | 2010 | 4,133 | 18 | 58 | 22 | 18 | — |
Gold delivers velocity and yield, MSME supplies spread ballast, housing anchors asset quality, and construction finance captures high‑margin niches under a 20 % self‑imposed cap.
How the Pie Morphed : Quarter‑by‑Quarter Momentum
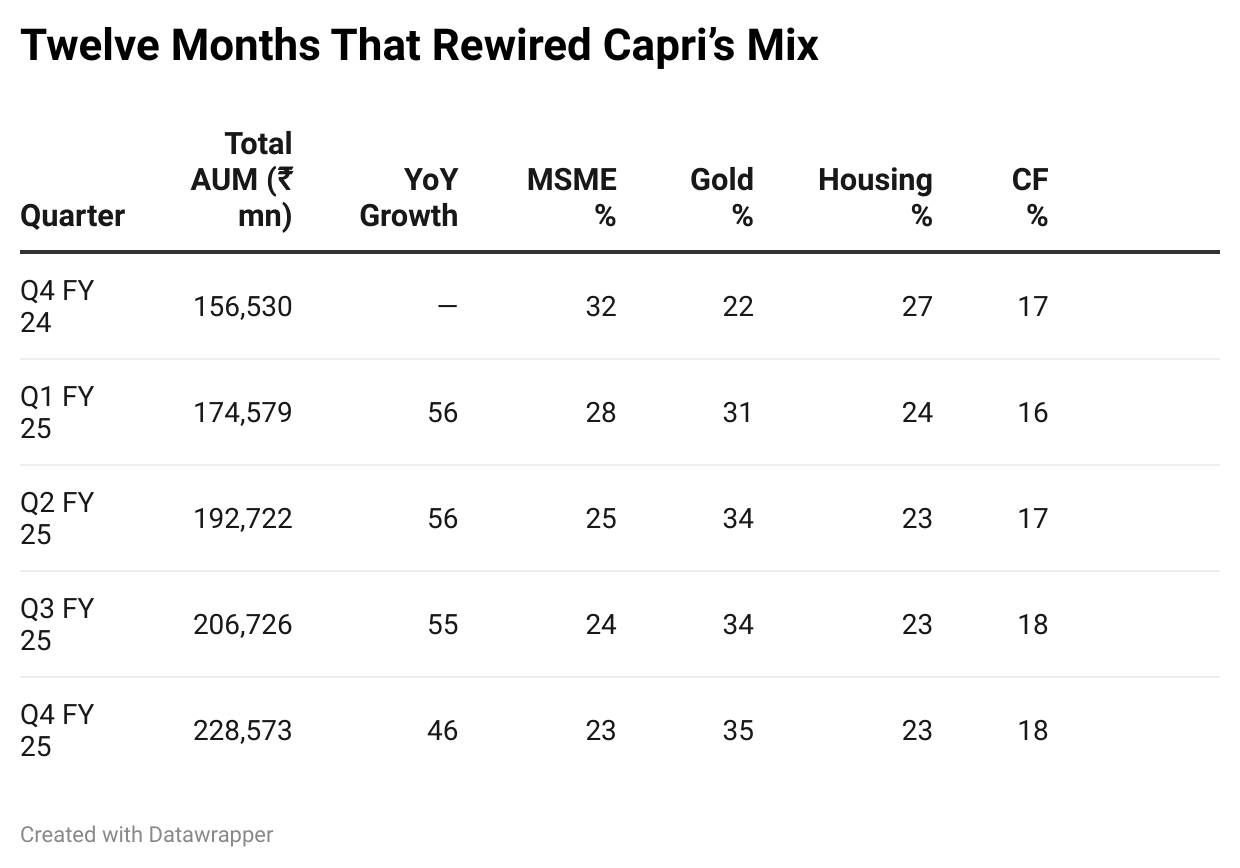
| Quarter | Total AUM (₹ mn) | YoY Growth (%) | MSME (%) | Gold (%) | Housing (%) | CF (%) |
|---|---|---|---|---|---|---|
| Q4 FY24 | 156,530 | — | 32 | 22 | 27 | 17 |
| Q1 FY25 | 174,579 | 56 | 28 | 31 | 24 | 16 |
| Q2 FY25 | 192,722 | 56 | 25 | 34 | 23 | 17 |
| Q3 FY25 | 206,726 | 55 | 24 | 34 | 23 | 18 |
| Q4 FY25 | 228,573 | 46 | 23 | 35 | 23 | 18 |
Gold cannibalised eight percentage points of share in four quarters. Hidden within the shift is ₹3,111 cr of incremental co‑lending AUM, turbo‑charging growth without stretching equity.
Margins, Money & the Math of Spread
| Fiscal | Yield on Advances | Cost of Funds | Spread | Net Interest Margin |
|---|---|---|---|---|
| FY23 | 14.9% | 8.4% | 6.5% | 8.1% |
| FY24 | 15.8% | 9.0% | 6.8% | 8.4% |
| FY25 | 16.5% | 9.6% | 6.9% | 8.8% |
Despite a 120 bp rise in funding cost, CGCL extracted 40 bp of incremental NIM over two years, testament to pricing power in gold and construction pockets.
Risk & Resilience : Algorithms as Insurance
| Segment | GNPA Q4 FY24 | Peak FY25 | GNPA Q4 FY25 | NNPA Q4 FY25 | Provision Cover |
|---|---|---|---|---|---|
| MSME | 3.9% | 5% | 3.9% | 2% | 49% |
| Gold | 0.9% | 1.1% | 0.8% | 0.7% | 33% |
| Housing | 1.3% | 1.7% | 1.4% | 0.9% | 39% |
| Construction | 1.0% | 0.3% | 0.2% | 0.1% | 50% |
MSME GNPA spiked to 5 % mid‑year but was clawed back, evidence that early‑warning bots work.
The gold book’s sub‑1 % GNPA, despite 167 % CAGR, underscores LTV discipline.
The Digital Backbone : 153 Programmers & a Few Bots
| Life-cycle Stage | Tool | What it Does | FY25 Impact |
|---|---|---|---|
| Origination | LoanXpress LOS | End-to-end digital sanction | –15 days MSME TAT |
| Risk Scoring | CapriScore & BRE | AI price-setting | 40 bps avg yield lift |
| Disbursal | e-Sign, e-Stamp, face ID | Paperless hand-off | 100% digital for gold |
| Early Alert | ML EWS, NPA Prediction | Bounce probability | 15% lower fresh slippage |
| Collections | CollectXpress | Route, agent, live dashboards | 99% gross collection |
| CX & Retention | AI-Dost chatbot, Auto-Pay | Self-service & renewals | +500 bps gold renewals |
A 90-100 Cr of tech budget rivaling mid‑size IT firms converts rupees into code. QIP proceeds will fuel gen‑AI fraud detection and real‑time compliance dashboards.
Humans Behind the Algorithms
| Name | Current Title | Vintage with CGCL | Previous Stints | Core Expertise | Industry Tenure |
|---|---|---|---|---|---|
| Rajesh Sharma | Managing Director | Promoter (2010–) | Nucleus Finance, Indiabulls | Strategy & capital | 30 yrs |
| Sanjeev Srivastava | Chief Risk Officer | 1 yr 8 mo | IIFL, GE Money, ICICI Bank | Credit-risk architecture | 24 yrs |
| Bhavesh Prajapati | Head – Credit, Risk & Policy | 5 yrs | Aadhaar HFC, IDFC, DHFL | Retail underwriting | 20 yrs |
| Vijay K. Gattani | Director – Credit (CF) | 9 yrs 6 mo | Goldman Sachs, ICICI | Project finance | 15 yrs |
| Magesh Iyer | Chief Operating Officer | 2 yrs 3 mo | InCred, Reliance Cap, ICICI | Ops & scaling | 20 yrs |
| Abhishek Sinha | CBO – MSME & Micro LAP | 1 mo | Bajaj Finance, Tata Cap | New-product lift-off | 18 yrs |
| Ravish Gupta | Business Head – Gold | 3 yrs 3 mo | IIFL, GE Money, HDFC Bank | Gold-loan build-out | 20 yrs |
| Amar Rajpurohit | Business Head – MSME | 6 yrs 6 mo | AU Fin, Gruh, DHFL | SENP underwriting | 17 yrs |
| Munish Jain | Business Head – Home | 6 yrs 2 mo | Shriram HFC, GE Money | Affordable housing | 20 yrs |
| Prasanna K. Singh | Group Collections Head | 3 yrs 5 mo | Bajaj Fin, PNB HFC | Collections strategy | 18 yrs |
Lifetime credit losses \< ₹250 cr on ₹12,000 cr disbursed trace straight to this bench strength. Governance remains tight: 85 % independent board, zero pledges, no auditor resignations.
Capital, Liquidity & ALM : The Trapeze Net
| Metric (Q4 FY25) | Number |
|---|---|
| Consolidated CRAR | 22.80% |
| Debt-to-Equity | 3.7× (target ≤ 4×) |
| Borrowings on Floating Rate | 95% |
| Liquidity Buffer (cash + undrawn) | ₹1,827 crore |
| New Credit Lines Sanctioned FY25 | ₹7,625 crore |
| No. of Funding Partners | 22 banks & FIs |
No cumulative ALM gaps appear, but CRAR hugs the regulatory floor. An AA upgrade could trim cost of funds 40–50 bp; delays would crimp growth or demand more equity.
Integrated Red‑Flag Matrix
| Category | Flag | Materiality | Mitigant |
|---|---|---|---|
| Capital-raise U-turn | Equity need within 24 m | High | Monitor QIP use; formal leverage covenant |
| CRAR erosion | –1,700 bp in 24 m | Med-High | Post-raise CRAR ≥ 25% |
| Provision swings | ₹30 mn ⇄ ₹464 mn | Medium | Demand vintage curves |
| Co-lending opacity | Off-book GNPA unknown | Medium | Partner waterfall disclosure |
| Market borrowings | 324% ⇄ –67% QoQ | Medium | Publish tenor ladder |
None fatal alone, but collectively signal growth outrunning disclosure. Richer data, not slower growth, is the remedy.
The Peer Mirror
| NBFC (HFC) | FY25 AUM (₹ cr) | Yield | NIM | ROA | GNPA | Core Niche |
|---|---|---|---|---|---|---|
| Capri Global | 22,857 | 17.3% | 8.8% | 2.7% | 1.5% | Multi-secured |
| Five-Star Business | 18,200 | 23.7% | 11.6% | 8.2% | 1.3% | Micro-LAP |
| Aavas Financiers | 16,400 | 13.1% | 5.4% | 3.3% | 0.8% | Affordable housing |
| Aptus Value HFC | 13,700 | 17.4% | 9.0% | 7.7% | 0.6% | Self-employed housing |
The quartet sketches India’s secured‑lending risk‑return frontier. Five‑Star and Aptus squeeze eye‑watering ROA from microlending niches, but the pay‑off comes with single‑segment and regional concentration that could magnify any localised shock.
Aavas sits at the opposite pole, razor‑thin spreads, bond‑like stability, and a valuation that already prices in its prudence.
Capri plants its flag on the middle ground: it cedes 350–400 bp of NIM to buy multi‑collateral diversification, broader funding access, and a longer compounding runway. The headline margins look modest, but the tail‑risk buffer makes the trade‑off a net positive for investors who value longevity over adrenaline.
Outlook & Monitoring Checklist
| Horizon | KPI | Bull Trigger | Bear Signal |
|---|---|---|---|
| FY26 | AUM ≥ ₹29,000 cr | Gold & Micro-LAP traction | Tech slip > 2 qtrs |
| ROE ≥ 14% | C/I ≤ 52%, Credit cost ≤ 0.6% | Spread squeeze | |
| CRAR ≥ 25% | QIP priced ≤ 3% discount | Delay or steep discount | |
| FY27 | ROE ≥ 15% | Sustain C/I drilldown | GNPA > 2% |
| FY28 | AUM ₹50,000 cr | 27–30% CAGR, NNPA ≤ 1% | CRAR \< 20% |
The FY28 goal implies rapid growth plus pristine asset quality. Watch NIM, leverage and CRAR quarterly for stress signals.
Can Discipline Survive Scale?
CGCL’s decade‑long record \< ₹250 cr lifetime NPAs on ₹12,000 cr disbursed, earns it a compounder’s halo. Yet the next chapter hinges on capital choreography:
- Leverage Maths. Only 0.3 turns of headroom remain below the 4× ceiling; either internal accruals or fee income must accelerate, or growth must temper.
- Transparency Premium. Investors will pay up only if the fast‑growing co‑lending portfolio is fully unsealed.
- Tech, not Hype. Early‑warning bots are powerful, but provision volatility shows model drift, scrutinise loss curves, not demos.
Bottom Line. Capri Global is investable as a disciplined growth story if one accepts episodic dilution risk and keeps hawk‑eye vigilance on leverage, capital buffers, and co‑lending disclosure. Should management pair broader guidance with an equally granular capital plan, the final credibility overhang dissolves, nudging every forensic pillar to Strong.
Note : No Buy/Sell recommendation. Purely for educational purposes.
This piece is created using CompoundingAI’s chat & forensic report.
CompoundingAI is an enterprise-grade vertical intelligence engine that transforms unstructured corporate filings into decision-grade insights within minutes, complete with source-level traceability for confident, auditable workflows.
Powered by CompoundingAI — AI research platform for Indian stocks, every claim cited from primary filings
Login Now