Gridlines of Growth: A Glimpse of T&D Capex and Skipper Ltd’s Journey Through It │ CompoundingAI
India’s Transmission-&-Distribution Super-Cycle : Domestic Muscle, Global Context
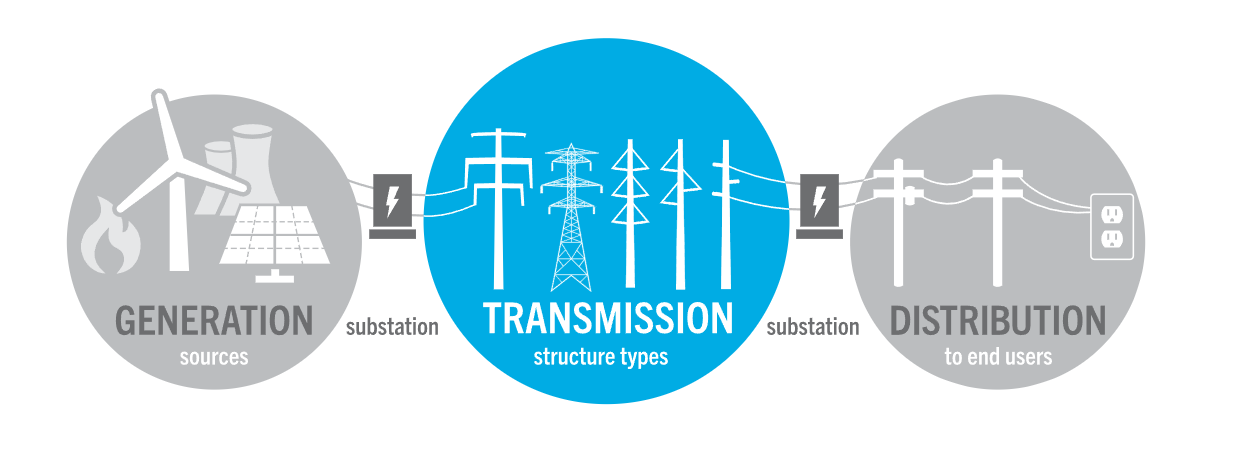
India’s Transmission & Distribution (T\&D) grid is no longer backstage plumbing; it is the central nervous system of every major growth story, from evacuating 500 GW of renewable power to feeding AI-hungry data-centres and charging a projected 30 million EVs this decade. But India is not building in isolation. Around the world, utilities and governments are pouring record sums into high-voltage corridors, smart meters and power electronics, making the next 25 years the most ambitious grid-build in history.
Global Grid Investment Trends
| Metric | 2019–23 (Actual) | 2024–29 (Projected) |
|---|---|---|
| Cumulative T\&D investment (US $ billion) | 1,644 | 3,053 |
Global Transmission Expansion Forecast
| Metric | 2021 Baseline | 2050 Projection | Net Addition (2021–50) |
|---|---|---|---|
| Installed transmission length (million km) | 5.3 | 12.7 | +7.4 |
India’s “Power Highway” in Numbers
| Metric | FY20 | FY24 / Jan-25 | 2030–32 Target |
|---|---|---|---|
| Gross power consumption (BU) | 1,292 | 1,739 | 6–8% CAGR |
| Installed power capacity (GW) | 370 | 466.2 | 817.5 |
| Renewable energy capacity (GW) | 87 | 209.5 | 500 |
| Peak electricity demand (GW) | 183 | 250 | 388 (FY32) |
| Inter-regional transfer capacity (GW) | 105 | 119 | 168 (FY32) |
| Transmission line length (’000 CKM) | 422 | 485 | 648 (FY32) |
| T\&D EPC market size (US $ billion) | 13-13.5(2023) | 16(2025F) | 20.5-21(2029F) |
Distribution Scoreboard
| Indicator | FY23 | FY24 / FY25 | Trend / Target |
|---|---|---|---|
| AT\&C losses | 15.4 % | 17.6 % | RDSS aims \< 15 % by FY25 |
| DISCOM overdues (₹ crore) | 1,02,780 (FY22 peak) | 25,419 (Q1-FY25) | 75 % reduction via LPS & RDSS |
Five Structural Reasons India Matters on the World Grid Map
| Catalyst | Why It Moves the Needle |
|---|---|
| Demand Shock | Consumption up 7 % YoY; CEA sees another +138 GW peak-load jump by FY32. |
| Renewables Everywhere | Evacuating 500 GW green capacity needs long-haul HVDC backbones and FACTS nodes. |
| Policy-Fuelled Capital Avalanche | Energy commands 24 % of the National Infrastructure Pipeline; RDSS injects ₹3.03 lakh crore into loss-cutting distribution upgrades. |
| Digital Dividend | 97 million smart meters still to install—critical for cash-positive DISCOMs and granular demand response. |
| Export-Ready EPC Hub | Kalpataru, KEC, L\&T, Skipper already ship towers and turnkey EPC to Africa, LATAM and the Middle East, turning India into a net exporter of grid capacity. |
An Introduction to Skipper Ltd
Amid an increase in transmission and distribution (T\&D) investments in India and select international markets, Skipper Ltd. has maintained a presence as an integrated player in engineering and infrastructure.
The company operates across three primary segments: transmission tower manufacturing, EPC execution, and polymer piping. Over the past few years, it has expanded its operational capacity, reported changes in key financial metrics, and diversified its order book to include domestic and export markets.
Its capital allocation approach, execution track record, and geographic footprint have evolved in line with the sector’s structural trends.
This report offers a data-driven assessment of Skipper’s recent performance, covering segmental developments, financial trajectory, strategic decisions, and risk exposures, to support informed analysis.
1. Historical Financial Performance Overview (FY22–FY25)
| Metrics (₹ crore) | FY22 | FY23 | FY24 | FY25 | 3-year CAGR |
|---|---|---|---|---|---|
| Revenue | 1,707 | 1,980 | 3,282 | 4,624 | 39% |
| EBITDA | 168 | 193 | 319 | 452 | 39% |
| EBITDA Margin (%) | 9.8% | 9.7% | 9.7% | 9.8% | Stable |
| PAT | 29 | 47 | 82 | 149 | 81% |
| ROCE (%) | 9.2% | 14.8% | 17.6% | 21.7% | Significant |
Skipper achieved robust 39% CAGR in revenue primarily driven by strong volume growth. Stable EBITDA margins (\~9.7%–9.8%) amid significant revenue expansion underscores disciplined pricing strategies.
Notably, PAT outpaced revenue growth due to improved debt management, significantly elevating ROCE, a clear indicator of efficient capital deployment.
2. Segment-wise Revenue & EBITDA Evolution
Revenue by Segment (₹ crore)
| Segment | FY22 | FY23 | FY24 | FY25 | CAGR |
|---|---|---|---|---|---|
| Engineering (T\&D) | 1,322 | 1,524 | 2,231 | 3,518 | 38% |
| Infrastructure | 65 | 51 | 598 | 674 | 125% |
| Polymer | 320 | 406 | 453 | 432 | 10% |
Segment EBITDA Margins (%)
| Segment | FY22 | FY23 | FY24 | FY25 | Trend Analysis |
|---|---|---|---|---|---|
| Engineering (T\&D) | 12.2% | 11.3% | 11.6% | 11.2% | Stable & Resilient |
| Infrastructure | -5.8% | 3.1% | 6.0% | 5.9% | Strong Recovery |
| Polymer | 3.4% | 4.7% | 5.3% | 4.3% | Low Utilisation Challenges |
Engineering remains Skipper’s profitability cornerstone, consistently delivering stable margins despite raw material volatility. Infrastructure’s turnaround from loss-making to profitable highlights effective project selection and execution.
However, the Polymer segment's low margins reflect persistent underutilisation and competitive pressures, an area ripe for strategic reevaluation.
3. FY25 Quarterly Financial Performance
| FY25 (₹ crore) | Q1 | Q2 | Q3 | Q4 (Record) |
|---|---|---|---|---|
| Revenue | 829 | 846 | 1,135 | 1,288 |
| EBITDA Margin | 11.0% | 11.5% | 9.8% | 9.6% |
| PAT | 36 | 39 | 36 | 48 |
| PAT Margin (%) | 4.4% | 4.6% | 3.2% | 3.7% |
Q4’s record performance indicates robust demand visibility and operational scaling. Slight EBITDA margin contraction was offset by disciplined cost management and lower finance costs, driving a substantial increase in PAT margin.
The Q4 figures provides significant upward revisions for FY26 revenue forecasts.
4. Order Book Analysis (FY24–FY25)
| Segment | FY24 (₹ crore) | FY25 (₹ crore) | YoY Growth |
|---|---|---|---|
| Domestic T\&D | 4,418 | 5,315 | +20% |
| Domestic Non-T\&D | 1,063 | 1,275 | +20% |
| Exports | 702 | 869 | +24% |
| Total Order Book | 6,182 | 7,458 | +20% |
Order book growth highlights strong domestic stability and strategic international expansion. Export orders, outpacing domestic growth, reflect targeted geographic diversification into higher-margin international markets.
With a 15–30 month execution window, revenue visibility into FY27 remains robust.
5. Export Market Expansion Strategy
Skipper’s refined export strategy transitions from an overly ambitious revenue-driven model to targeted, margin-enhancing geographic concentration. The recalibrated goal of achieving \~25% export share by FY27 underlines prudent risk management and margin discipline.
Export Revenue Breakdown (FY25)
| Region | Revenue Share | Key Markets | Rationale |
|---|---|---|---|
| Africa | \~18% | Kenya, Ghana, Nigeria, Egypt | Multilateral funding ensures stable cash flow |
| South America (LATAM) | \~9% | Brazil, Peru, Chile | Infrastructure upgrades, diversification |
| South/S-E Asia | \~9% | Bangladesh, Philippines, Vietnam | Geographical proximity, cost advantage |
| Others | Remaining | US, Middle East, Europe, Oceania | High-margin specialised products (e.g., steel poles) |
Skipper’s strategic pivot toward high-potential African markets provides stable cash flows due to reduced sovereign risks. Potential entry into lucrative North American steel pole markets, characterised by superior margins (\~13%+ EBITDA), represents a substantial margin uplift opportunity.
6. Working Capital Management Trends
| Days | FY22 | FY23 | FY24 | FY25 |
|---|---|---|---|---|
| Inventory | 170 | 135 | 95 | 95 |
| Debtors | 70 | 89 | 62 | 62 |
| Payables | 109 | 136 | 62 | 62 |
| Net WC | 133 | 130 | 88 | 95 |
Significant reduction in inventory and debtor cycles has freed substantial operating cash, funding growth internally and reducing financial leverage. The working capital discipline has effectively become Skipper’s invisible margin booster.
7. Capital Structure and Debt Management
| Metrics | FY22 | FY23 | FY24 | FY25 |
|---|---|---|---|---|
| Gross Debt (₹ cr) | 567 | 484 | 577 | 701 |
| Debt-to-Equity (x) | 0.77 | 0.63 | 0.64 | 0.59 |
| Interest Cover (x) | 1.80 | 1.85 | 2.07 | 2.12 |
Disciplined capital structure improvements showcase Skipper’s prudent debt management strategy, enhancing solvency metrics even amid capacity expansions.
8. Guidance Adherence & Management Credibility
| Metric | Target | FY25 Actual | Verdict |
|---|---|---|---|
| Revenue Growth | >25% CAGR | 39% CAGR | Exceeded |
| EBITDA Margin | >10% | 9.8% | Near Target |
| Polymer Revenue | ₹1,000 cr FY24 | ₹432 cr | Significant Miss |
| Export as % of Engg | 75% | 22% | Significant Miss |
Management’s credibility remains high on overall growth; however, overly ambitious Polymer and Export segment targets suggest optimism bias requiring cautious interpretation.
9. Financial Reporting Quality
Skipper Ltd. has maintained robust standards of financial reporting over the evaluated period (FY22–FY25), demonstrating consistency, clarity, and transparency in its disclosures across quarterly and annual results. The detailed and systematic representation of segmental data, operational metrics, and capital deployment reflects mature governance practices and a strong commitment to investor communication.
However, the notable change of auditors in FY24 merits caution and proactive monitoring. While auditor changes are common in corporate environments and no specific concerns or red flags have emerged thus far, such transitions naturally require investors and management to maintain heightened vigilance.
The management's proactive stance in openly communicating these changes, coupled with continued adherence to stringent disclosure practices, reassures stakeholders.
10. Risk Management & Strategic Responses
Skipper Ltd. operates in a high-growth yet cyclically sensitive industry, making proactive risk identification and management imperative. The following strategic risks have been explicitly identified and actively managed by Skipper’s leadership:
Key Identified Risks:
- Polymer Segment Margin Stagnation:
The Polymer segment's persistent low margins and suboptimal capacity utilisation (\~55%) present significant profitability and return challenges. Continued stagnation threatens overall consolidated margins. - Export Revenue Volatility:
While exports offer higher margins, geopolitical uncertainties, currency fluctuations, and country-specific risks introduce revenue volatility that could disrupt profitability targets. - Auditor Stability:
Recent auditor changes raise potential concerns around financial continuity and transparency, necessitating close monitoring to maintain stakeholder trust. - Financial Transparency and Credibility:
The consistent credibility in revenue and EBITDA guidance contrasts sharply with missed niche-segment targets, potentially eroding investor confidence in management’s forecasting reliability.
Strategic Management Responses:
- Recalibrated Export Targets:
Management’s strategic pivot from aggressive (initial 75%) to realistic and achievable export targets (\~25%) significantly mitigates geographical risk exposure and margin erosion, emphasising quality growth rather than volume-driven expansion. - Potential Strategic Review of Polymer Segment:
Management has acknowledged underperformance in the Polymer division, initiating a comprehensive strategic reassessment. This includes exploring potential divestitures, partnerships, or operational restructuring to revitalise segment profitability and utilisation. - Heightened Financial Vigilance:
In response to auditor changes and financial transparency concerns, Skipper has reinforced internal financial controls and governance frameworks. Ongoing audits and strengthened oversight committees underscore management's commitment to financial integrity and stakeholder trust.
In aggregate, Skipper demonstrates a proactive and transparent approach to risk management, aligning strategic responses with evolving market realities, investor expectations, and internal operational benchmarks.
11. Capital Allocation Strategy
Skipper Ltd. has embraced a disciplined and methodical capital allocation framework, fundamentally anchored in prudent capacity expansions and stringent return-on-investment criteria. This structured approach ensures sustainable value creation and mitigates investment risks associated with large-scale capital deployments.
Phased 75-kt Capacity Expansions:
Skipper’s capacity growth occurs incrementally, with each 75-kt (kilotonne) expansion phase activated strictly upon reaching utilisation benchmarks (≥80%) on existing assets. This disciplined gating approach safeguards against overcapacity and inefficient capital deployment, maintaining robust ROCE consistently above the strategic 20% threshold.
| Capacity Block | Capital Outlay | Utilisation Trigger | Estimated Payback | Status |
|---|---|---|---|---|
| FY25 Expansion | ₹200 crore | >80% | \<2 years | Operational Q1 FY26 |
| FY26 Planned | ₹200-250 crore | >80% | \<2 years | Awaiting Approval |
| FY27 Conceptualised | \~₹200 crore | >80% | \<2 years | Strategic Planning |
Digital Transformation via SAP S/4 HANA Implementation:
From FY26 onwards, the enterprise-wide rollout of SAP S/4 HANA ERP significantly enhances operational transparency, productivity, and data-driven decision-making. Real-time analytics and integrated operational KPIs directly feed into strategic pricing and bidding decisions, ensuring improved financial forecasting, reduced operational risks, and heightened capital efficiency.
12. The CIO Dashboard
The CIO dashboard provides concise yet powerful insights into Skipper’s ongoing operational health, financial discipline, and strategic execution capability. Maintaining focus on these critical indicators ensures continued investor confidence and strategic clarity.
| Key Performance Indicator | FY25 Actual | Ideal Benchmark | Strategic Significance |
|---|---|---|---|
| Finance Cost-to-Sales | 4.6% | \<4.7% | Reflects debt discipline & working capital efficiency. Maintaining below 4.7% ensures cash flow sustainability. |
| Polymer EBITDA Margin | 4.3% | >6% by FY26 | Critical indicator for evaluating Polymer segment turnaround. Achieving targeted margin signals operational effectiveness. |
| Bid Conversion Rate | 25%–30% | >20% | Demonstrates competitive positioning and operational excellence. Maintaining rates above 20% indicates strong market demand & effective bidding strategies. |
Dashboard Commentary:
- Finance Costs:
The FY25 ratio of 4.6% confirms disciplined financial management and sustainable leverage. The target threshold (\<4.7%) ensures continued efficiency gains through improved cash flow and reduced borrowing costs. - Polymer Margin:
The Polymer segment’s current margin (4.3%) remains below desired thresholds, necessitating immediate strategic intervention. Achieving >6% by FY26 will signal successful execution of capacity utilisation and market strategies. - Bid Conversion Rate:
Skipper’s consistently high bid conversion rate (25%-30%) underscores strong market competitiveness, robust demand forecasting, and effective pricing. Staying consistently above 20% indicates resilient market positioning and reliable revenue pipeline generation.
Conclusion:
Skipper Ltd.’s strategic trajectory from FY22 through FY25 exhibits disciplined financial governance, strategic operational pivots, and proactive risk mitigation. While certain segments and guidance ambitions require cautious interpretation, Skipper’s demonstrated capability in financial discipline, measured capacity growth, and strategic market diversification positions it strongly for sustainable value creation.
Key areas for vigilance include monitoring Polymer segment revitalisation, continued audit transparency, and disciplined financial metrics adherence. By closely tracking the indicators, Skipper is well-positioned for consistent strategic execution, ensuring continued robust growth, profitability, and long-term stakeholder value creation.
Note : No Buy/Sell Recommendation. Only for educational purposes.
This piece is created using CompoundingAI’s chat & forensic report.
CompoundingAI is an enterprise-grade vertical intelligence engine that transforms unstructured corporate filings into decision-grade insights within minutes, complete with source-level traceability for confident, auditable workflows.
Powered by CompoundingAI — AI research platform for Indian stocks, every claim cited from primary filings
Login Now