India’s Seafood Industry: Global Trade, Aquaculture, and Corporate Performance
Seafood has emerged as one of the fastest-growing protein categories globally, supported by rising incomes, health-driven diets, and demand for premium ready-to-eat formats. India is now the world’s fourth-largest exporter, with shrimp contributing nearly 70% of value.
FY25 was a turning point: exports held steady at \~US$7.45B despite a dip in volume, EU approvals expanded premium market access, and the India–UK FTA unlocked tariff-free opportunities. Yet volatility persisted, with US trade duties and Ecuador’s aggressive supply putting pressure on prices.
Amid these shifts, India’s industry is adapting through diversification, traceability, and sustainability. This report covers global dynamics, India’s aquaculture strengths, policy support, risks, and company performance, concluding with an Investor Lens on valuations and portfolio implications.
1. Global Seafood Industry Overview
Despite cyclical volatility, the global seafood industry remains structurally resilient.
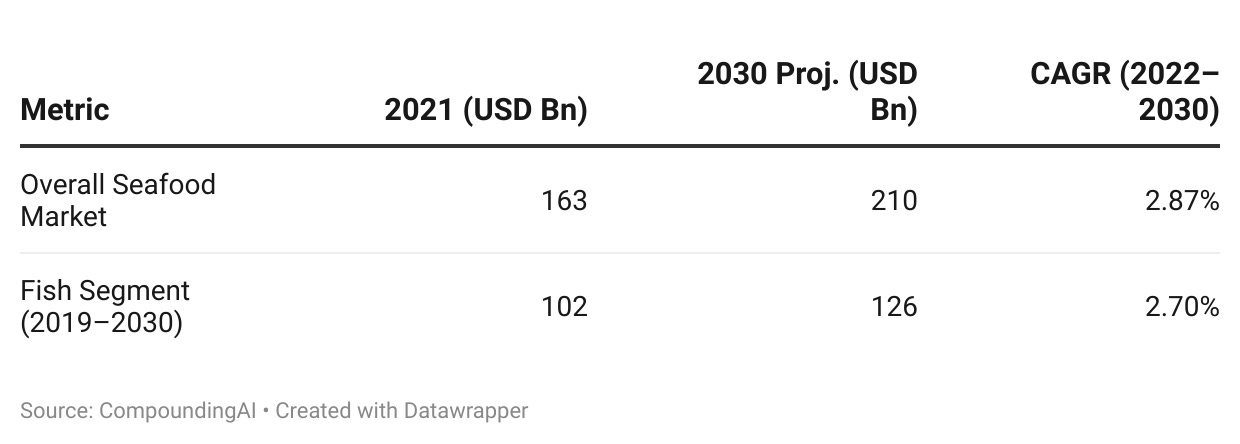
- Market Size (2021): USD 163.1 billion
- Projection (2030): USD 210.4 billion
- CAGR (2022–2030): 2.87%
- Fish Segment: USD 101.5 billion in 2019 → USD 125.9 billion by 2030 (CAGR 2.7%)
Growth Drivers:
- Expanding global population and incomes.
- Increasing awareness of seafood’s nutritional profile.
- Aquaculture’s rise, reducing dependence on capture fisheries.
- Logistics and cold chain advances, enabling wider reach.
| Metric | 2021 (USD Bn) | 2030 Projected (USD Bn) | CAGR (2022–2030) |
|---|---|---|---|
| Overall Seafood Market | 163.1 | 210.4 | 2.87% |
| Fish Segment (2019–2030) | 101.5 | 125.9 | 2.7% |
2. Indian Seafood Industry Landscape
India has established itself as a heavyweight in global seafood, supported by an 8,118 km coastline, aquaculture-friendly conditions, and a large labour pool. The country is especially dominant in shrimp exports.
FY25 Highlights:
- Exports: \~1.78 million MT valued at ₹64,000 crore (USD \~7.7 billion).
- Shrimp: \~70% of total export value.
- Regional Concentration: Andhra Pradesh contributes over 30% of exports.
- Employment: Over 40 million livelihoods tied to fisheries; \~1 million in shrimp farming.
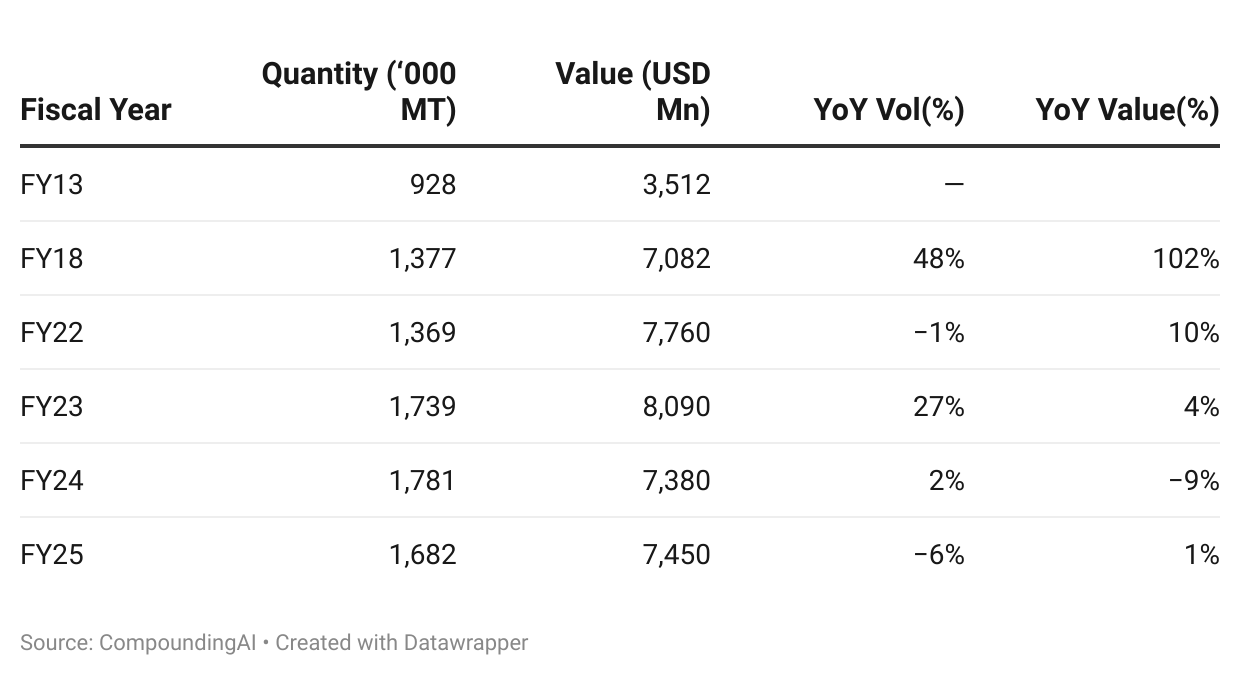
Export Performance (FY13–FY25)
| Fiscal Year | Quantity (‘000 MT) | Value (USD Mn) | YoY Vol | YoY Value |
|---|---|---|---|---|
| FY13 | 928 | 3,512 | — | — |
| FY18 | 1,377 | 7,082 | 48% | 102% |
| FY22 | 1,369 | 7,760 | -1% | 10% |
| FY23 | 1,739 | 8,090 | 27% | 4% |
| FY24 | 1,781 | 7,380 | 2% | -9% |
| FY25 | 1,682 | 7,450 | -6% | 1% |
1. When Volume ↑ faster than Value ↑ (e.g., FY23: +27% volume vs +4% value)
- Exports surged in quantity but realizations (average $/kg) fell.
- Indicates global price pressure (Ecuador flooding the shrimp market, weaker demand in US/EU, or buyers pushing down contract prices).
- Could also reflect shift toward lower-value species / smaller shrimp sizes.
Read-through: Margins squeezed, even though top line in MT looks strong.
2. When Volume \~flat but Value ↓ (e.g., FY24: +2% volume vs –9% value)
- Exporters shipped more, but earned less.
- Suggests sharp fall in realizations, often tied to global oversupply or tariff-led price cuts.
- FY24 is a textbook case: Ecuador’s oversupply pulled down global shrimp prices.
Read-through: PAT compresses; working capital gets stressed because receivables rise while cash inflows lag.
3. When Volume ↓ but Value ↑ (e.g., FY25: –6% volume vs +1% value)
- Fewer tonnes exported, but better realizations.
- Drivers:
- Currency effects (₹ depreciation makes exports more valuable in INR, partially lifting USD realization).
- Product mix shift toward higher-margin, larger shrimp or processed / RTE formats.
- Market diversification into EU/UK where realizations are higher.
Read-through: Resilience, the sector is learning to defend value despite weaker volumes. Signals margin recovery if mix improvement sustains.
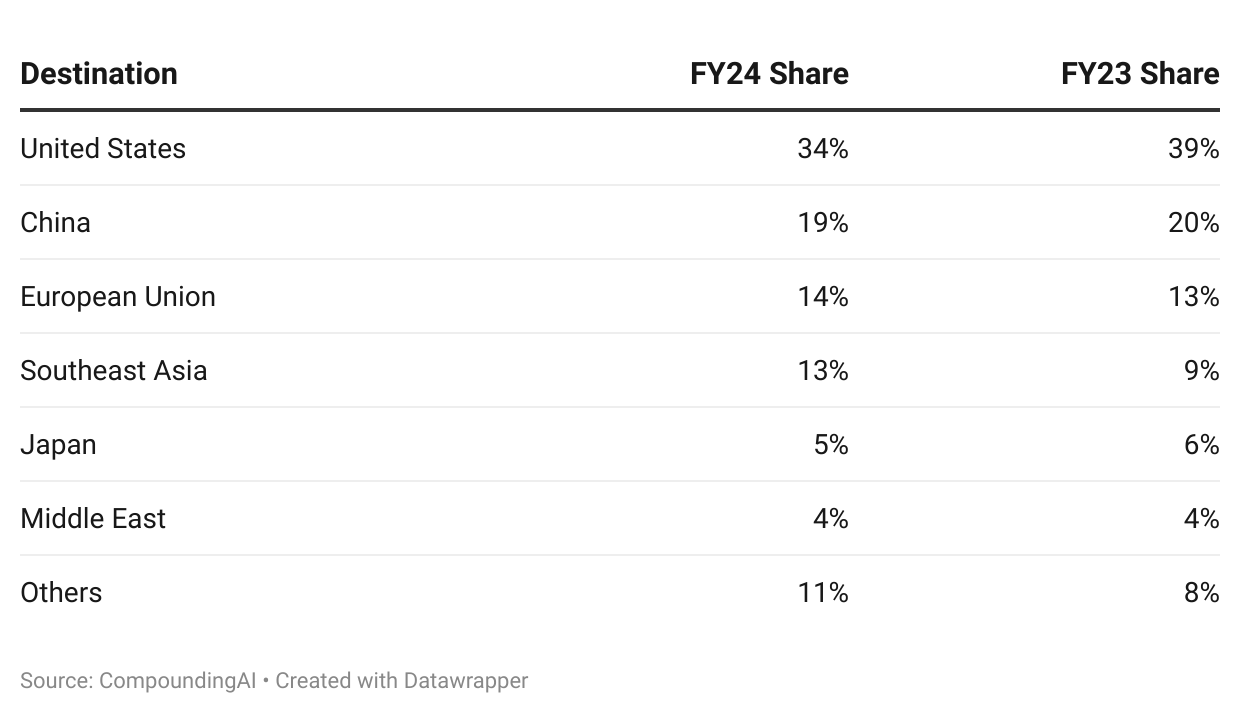
Export Destination Mix
| Destination | FY25 Share | FY24 Share | FY23 Share |
|---|---|---|---|
| United States of America | 32% | 34% | 39% |
| China | 20% | 19% | 20% |
| European Union | 15% | 14% | 13% |
| Southeast Asia | 12% | 13% | 9% |
| Japan | 5% | 5% | 6% |
| Middle East | 4% | 4% | 4% |
| Others | 12% | 11% | 8% |
3. Aquaculture in India
Aquaculture is the backbone of India’s seafood exports.
- Market Size 2022: 12.4 million MT
- Projected 2028: 19.9 million MT (CAGR 8.1%)
- Shrimp Farming: Andhra Pradesh dominant; Gujarat expanding as a new hub.
- Untapped Potential: Only \~14% of 1.2 million hectares suitable for shrimp farming has been utilized.
Risks include disease (white spot, EMS), climate shocks, and feed cost inflation. Mitigation ranges from bio-secure indoor farming to government-backed brood stock programs.
4. Government Initiatives
- Blue Revolution: Structural modernization.
- PM Matsya Sampada Yojana (PMMSY): Targets doubling exports to ₹1 lakh crore and adding 5.5 million jobs.
- Financial Support: NABARD loans cover 80% of project costs; processing units eligible for grants of up to ₹10 crore.
- Trade Tailwinds: India–UK FTA removes tariffs; EU approval for 102 new processing units expands access.
5. Value Chain & Business Models
Value Chain
From hatchery and feed to farming, processing, logistics, and distribution, India’s value chain is evolving toward greater integration.
Business Models
- Integrated farm-to-fork: Sharat, Apex, Kings Infra.
- Feed + processing specialists: Avanti, IFB Agro.
- Cold chain providers: Snowman Logistics.
- Tech-enabled aquaculture: Kings Infra (Blue-TechOS, SISTA360).
6. Challenges & Risks
- Global Competition: Ecuador’s low-cost shrimp supply depressed global prices, eroding Indian margins.
- Trade Policy: US CVD (5.77%) and ADD escalated into a 50% tariff shock, cutting processing margins.
- Freight Inflation: Apex’s freight costs surged 127% YoY in FY25.
- Feed Volatility: Fishmeal and soymeal inflation impacted Avanti’s feed margins.
- Disease: White spot outbreaks remain recurring.
- Cold Chain: Infrastructure gaps cause \~USD 15 billion in food losses annually.
7. Company Deep Dives
Avanti Feeds
- Shrimp feed = \~80% revenue; processing and pet care diversifying.
- FY24 PAT margin beat guidance (9.75% vs 7–8%).
- Working capital stretched: receivable days rose to 23 in H1 FY25 (vs 8 historically).
- US exposure (\~60% of processing revenues) drove margins down to 9% in Q1 FY26.
- Diversifying into EU (17% share), Japan, Canada.
Apex Frozen Foods
- Secured EU Ready-to-Eat approval in FY26, adding \~2,500 MT with 10–15% higher realizations.
- Capacity utilization stuck at 32–35%.
- FY25 PAT fell 73% YoY; EU-driven rebound visible in FY26 (EU share = 39%).
Kings Infra Ventures
- Zero US exposure = tariff hedge.
- Land-based shrimp farms + Mari-tech Eco Parks.
- Blue-TechOS and SISTA360 for digital traceability.
- FY25: Revenue ₹124.5 Cr (+37%), EBITDA +67%, PAT +70%.
Sharat Industries
- Expanding into Gujarat; expected to add ₹100 Cr revenue from FY26.
- Integrated model with hatchery, feed, processing.
Coastal Corp
- BAP certified, FDA & EU approvals.
- Risks: high US dependency.
Zeal Aqua
- ASC, HACCP, FDA, BRC, MPEDA certifications.
- Strong compliance = premium buyer access.
Garware Technical Fibres
- Ancillary player: aquaculture nets, geosynthetics.
- Q1 FY26 revenue ₹367 Cr (+9%), PAT ₹53 Cr (+13.5%).
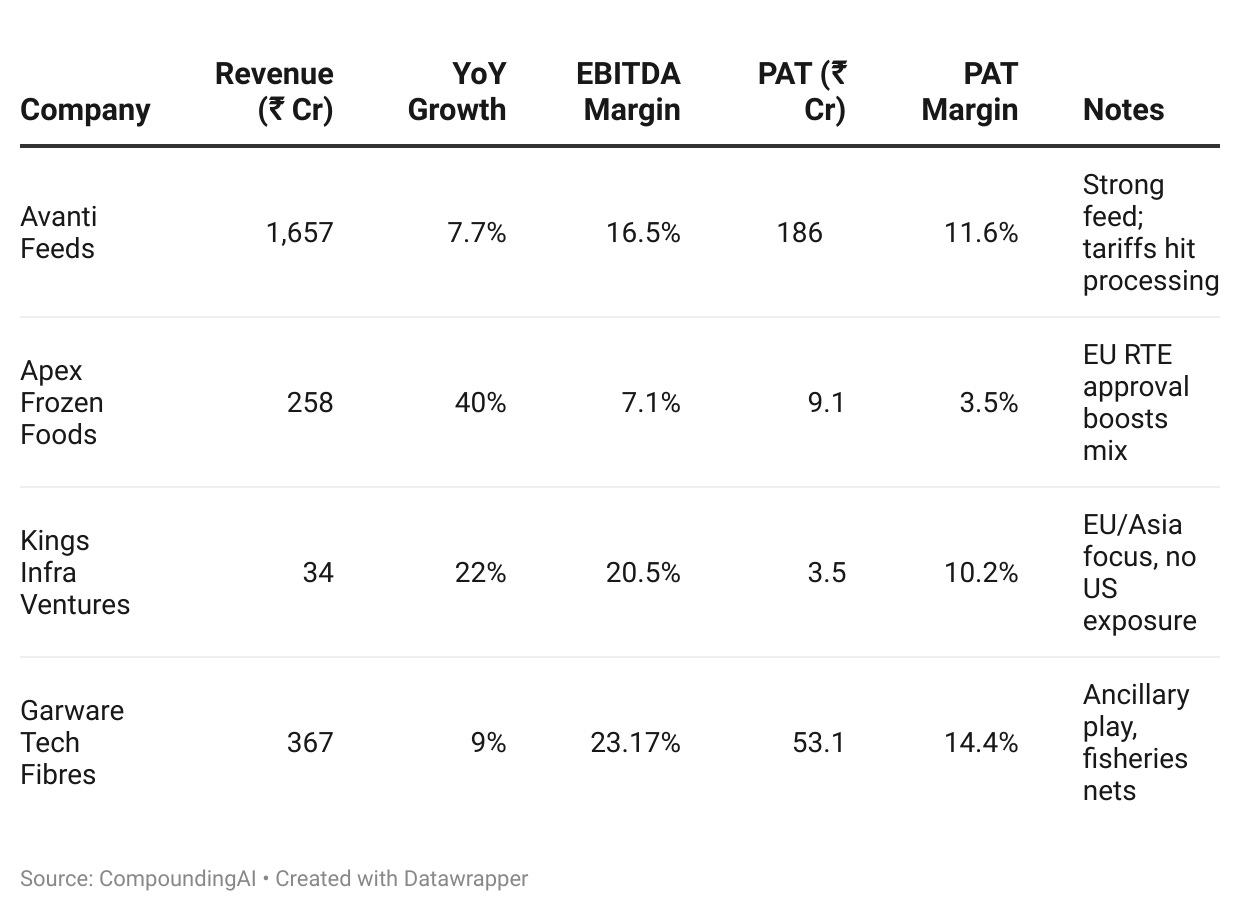
8. Financial Snapshot (Q1 FY26)
| Company | Revenue (₹ Cr) | YoY Growth | EBITDA Margin | PAT (₹ Cr) | PAT Margin | Key Notes |
|---|---|---|---|---|---|---|
| Avanti Feeds | 1,657 | +7.7% | 16.5% | 186 | 11.6% | Strong feed growth; US tariffs hit processing |
| Apex Frozen Foods | 258 | +40% | 7.1% | 9.1 | 3.5% | EU RTE approval boosts margins |
| Kings Infra Ventures | 34.2 | +22% | 20.5% | 3.5 | 10.2% | No US exposure, strong EU/Asia demand |
| Garware Tech Fibres | 367 | +9% | 23.17% | 53.1 | 14.4% | Ancillary play, global fisheries growth |
9. Outlook
- Export Diversification: US reliance falling; EU + Asia gaining share.
- Domestic Demand: Frozen and RTE seafood poised for growth with urban incomes.
- Regional Expansion: Andhra Pradesh leads, Gujarat and Odisha emerging.
- Structural Risks: Tariffs, disease, and feed volatility keep sector cyclical.
- Potential: Only 14% of shrimp capacity tapped; doubling output is feasible.
10. Investor Lens: Valuation & Portfolio Implications
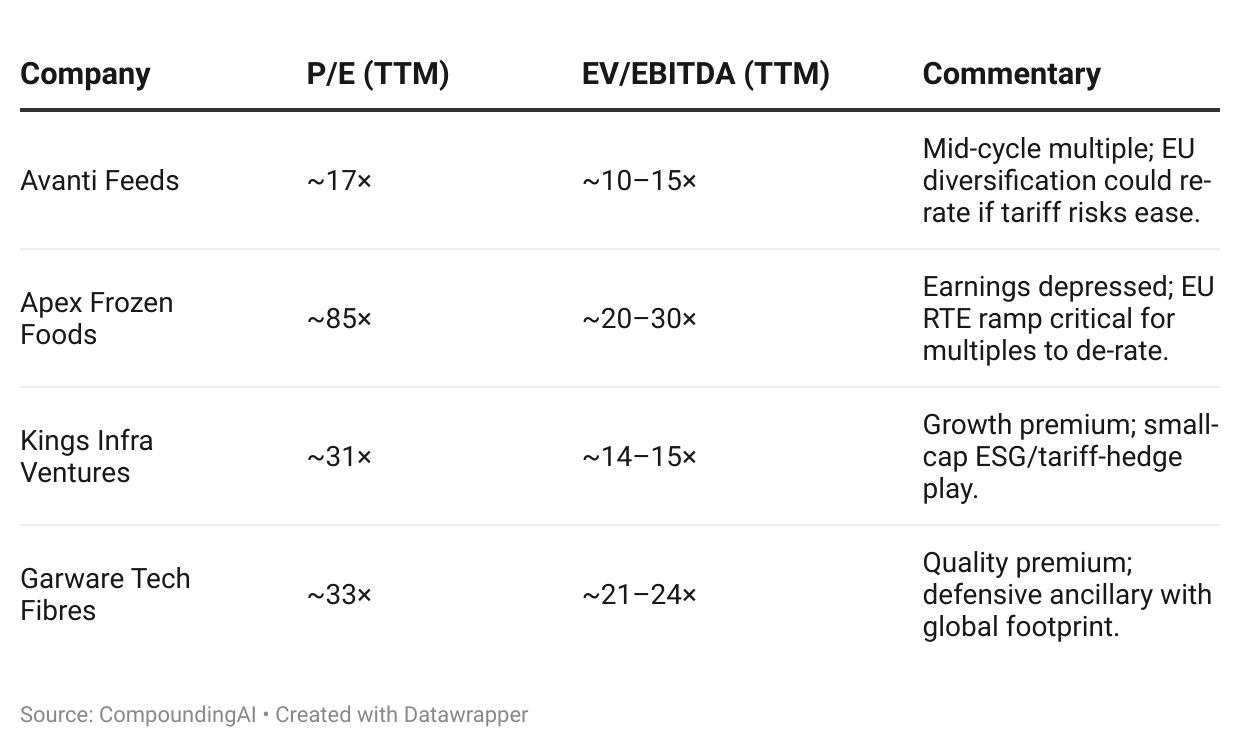
Valuation Context (TTM, as of Sep 2025)
| Company | P/E (TTM) | EV/EBITDA (TTM) | Commentary |
|---|---|---|---|
| Avanti Feeds | \~17× | \~10–15× | Mid-cycle multiple; tariff risks weigh, EU diversification could re-rate. |
| Apex Frozen Foods | \~85× | \~20–30× | Earnings depressed; EU RTE ramp key to de-rating multiples. |
| Kings Infra Ventures | \~31× | \~14–15× | Growth premium; niche ESG/tariff-hedge play. |
| Garware Tech Fibres | \~33× | \~21–24× | Quality premium; lower cyclicality vs exporters. |
Portfolio Takeaways
- Avanti Feeds — Scale leader, mid-teen multiple, near-term pressure from US tariffs but EU/Japan diversification provides optionality.
- Apex Frozen Foods — Expensive on TTM due to depressed earnings; EU RTE approvals offer upside if utilization improves.
- Kings Infra Ventures — Small-cap with ESG and traceability differentiation; high growth but illiquid.
- Garware Tech Fibres — Ancillary with global exposure; premium multiples justified by stability and lower cyclicality.
Bottom Line:
- Core Hold: Avanti (scale + diversification).
- High-Risk/High-Reward: Apex (turnaround on EU RTE success).
- Satellite Exposure: Kings Infra (niche ESG/tariff hedge).
- Defensive Ancillary: Garware (stable compounding, premium justified).
Closing Note
India’s seafood industry is at an inflection point. Policy support, aquaculture scale-up, and new trade access create multi-year growth potential.
Yet cyclicality in tariffs, diseases, and costs ensures uneven earnings. For investors, this sector offers structural growth but returns will accrue to companies that combine scale, diversification, and sustainability with disciplined financial management.
This piece is created using inputs only from CompoundingAI.
CompoundingAI is an enterprise-grade vertical intelligence engine that transforms unstructured corporate filings into decision-grade insights within minutes, complete with source-level traceability for confident, auditable workflows.
We cut the noise & directly deliver insights.
Note : This is not a buy/sell recommendation. For education purpose only.
Powered by CompoundingAI — AI research platform for Indian stocks, every claim cited from primary filings
Login Now