Powering the Future: What Top Five Country's Electricity Trends Reveal About Global Growth
Why Track Electricity ?
Electricity is the economy’s pulse generated and consumed in real time, difficult to manipulate, and directly tied to industrial output, digital activity and household comfort. When watts rise or fall, they leave fingerprints on commodities, policy and corporate earnings long before most macro indicators flash.
Dataset & Sources (2000‑2023)
| Country | Primary Source | 2023 demand (TWh) | Per‑capita (MWh) |
|---|---|---|---|
| China | Ember Global Electricity Review 2024 | \~10 800 | 7.6 |
| India | CEA Growth of Electricity Sector in India (2024) | \~2 480 | 1.8 |
| United States | Ember | \~4 750 | 14.0 |
| Japan | IEA Data Browser | \~940 | 7.6 |
| Germany | Energy Institute Statistical Review / Fraunhofer ISE | \~508 | 6.1 |
All figures refer to net electricity consumption to avoid generation‑versus‑import distortions and are rounded to highlight trends.
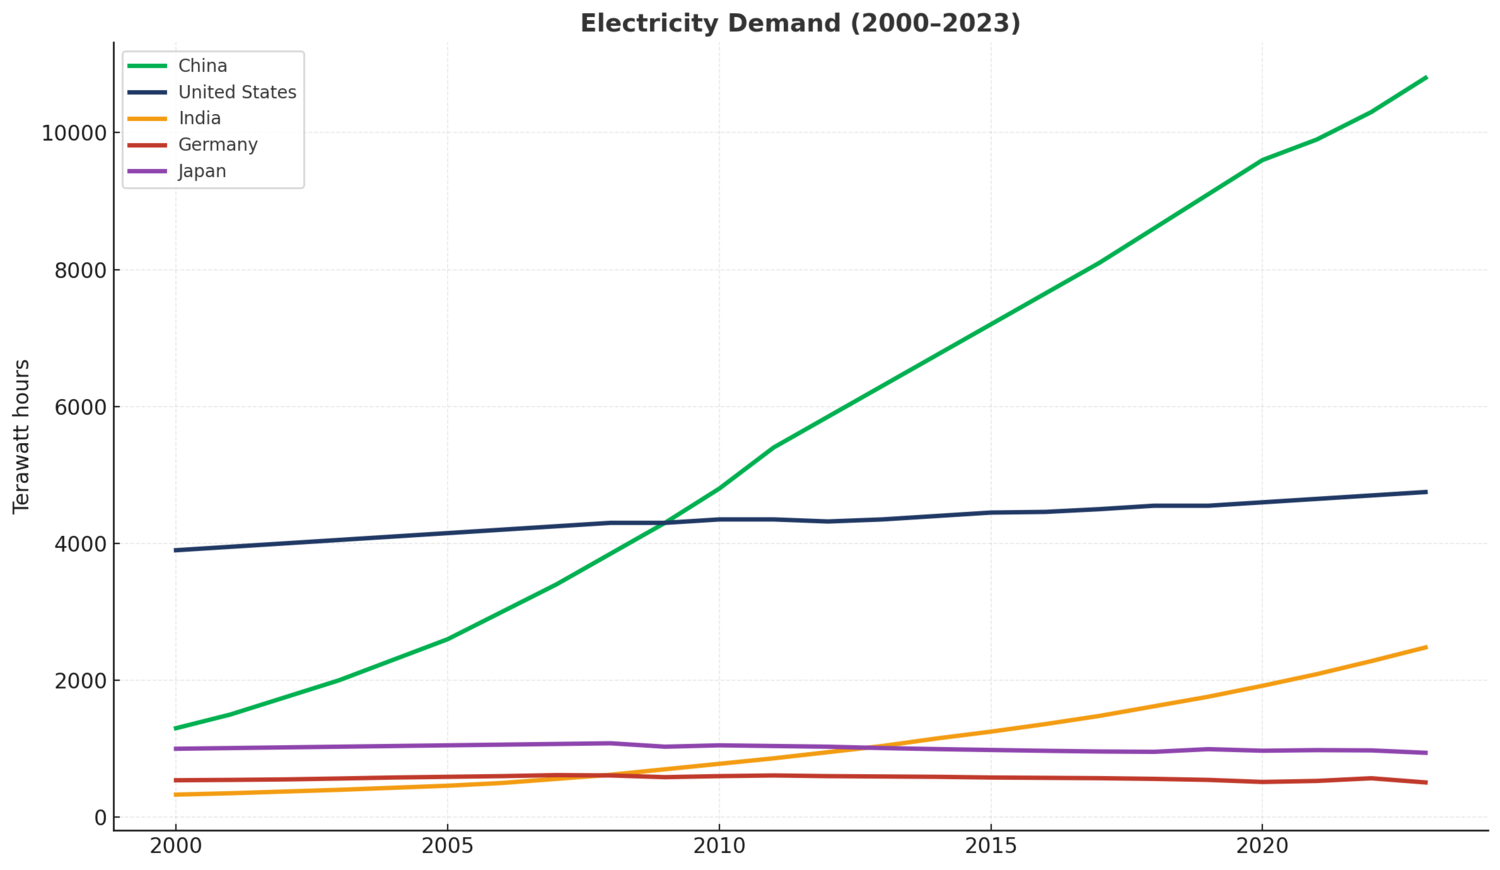
The Three‑Speed World, Visualised
| 2000 → 2023 change | 2000 (TWh) | 2023 (TWh) | Abs. Δ | CAGR* |
|---|---|---|---|---|
| China | ≈1 300 | ≈10 800 | +9 500 | 10.4 % |
| India | ≈ 330 | ≈ 2 480 | +2 150 | 9.0 % |
| United States | ≈3 900 | ≈4 750 | +850 | 0.8 % |
| Japan | ≈1 000 | ≈ 940 | –60 | –0.3 % |
| Germany | ≈ 540 | ≈ 508 | –32 | –0.3 % |
- China - The Behemoth
- Added >9 PWh since 2000 — effectively creating two new United States worth of demand.
- Growth cooled after 2015 but data‑centre load, EV charging and urban AC usage hint at a second‑wave upswing. Coal still shoulders the evening gap even as record solar and wind come online.
- India - The Rapid Riser
- Today’s curve looks like China’s in 2007. Per‑capita use remains one‑sixth of China’s, implying years of catch‑up growth. Rooftop AC penetration (\<15 %) is the stealth multiplier. Each 1 % rise requires \~7 GW of extra capacity.
- United States - The Plateau
- Demand flat around 4.5 PWh for two decades, yet hourly peaks are hitting new records. Flexibility—not volume—is the constraint, driving investment in storage and demand‑response. New hydrogen and data‑centre projects could finally nudge the line upward.
- Japan - Efficiency Over Expansion
- Post‑Fukushima conservation trimmed \~10 % off demand. GDP‑per‑kWh rose from ¥40 to ¥64 between 2010 and 2023, making Japan a living laboratory for energy‑lean prosperity.
- Germany - The Energiewende Paradox
- Consumption down \~20 % from its 2007 peak; renewables supply >57 % of remaining load. High energy prices and industry relocation explain much of the decline. Heat‑pumps and EVs could reverse part of the drop later this decade.
Five Curves, Ten Takeaways
- Growth gravity has shifted east. China plus India account for >70 % of net global demand growth since 2015.
- Per‑capita headroom matters. India’s low base means a 6 % annual rise is still “catch‑up,” not overheating.
- Peak‑load stress is universal. Even flat‑line economies are paying premiums for grid flexibility as weather volatility intensifies.
- Efficiency can decouple GDP from kWh but not jobs. Germany’s steel output has followed its declining electricity curve.
- Carbon intensity is only half the story. OECD grids are cleaner, yet global power‑sector CO₂ still climbs because absolute kWh expand faster elsewhere.
- Copper and aluminium remain leverage plays on Asian capex, while European gas demand is increasingly a swing factor for LNG pricing.
- Storage is the new baseload. Both China and India will need >200 GW of flexible capacity by 2030 to integrate their solar build‑outs.
- Hydrogen policy can bend mature curves. A single U.S. tax credit (45V) could add 50–70 TWh by 2030, enough to move the needle on an otherwise flat trajectory.
- Degrowth experiments are underway. Japan shows living standards can hold steady even as electricity shrinks but at the cost of industrial heft.
- Electricity is only 20 % of final energy in Germany. True decarbonisation demands electrifying heat and transport, hinting at a floor beneath the red line.
Closing Thoughts
Electricity demand is economics in motion. These five curves offer a live map of where capital, commodities and carbon will flow next. Whether you trade metals, price power‑purchase agreements, or model climate risk, anchoring your view in terawatt‑hours keeps you ahead of headline noise.
Powered by CompoundingAI — AI research platform for Indian stocks, every claim cited from primary filings
Login Now